Management & Ops
Panorama (Centralized Management) 50
Learning objectives
- Explain why centralized management is necessary once a fleet grows beyond a handful of firewalls
- Distinguish shared/device-group/template configuration from local overrides
- Identify which advanced features require Panorama as the provisioning point
Palo Alto's centralized management platform for configuring, monitoring, and updating fleets of NGFWs (and, per HA docs, the only way to get a consolidated cross-pair log/ACC view).
Why
Managing dozens or thousands of individual firewall web UIs doesn't scale; policy consistency, software/content updates, and fleet-wide visibility all need a single control point.How
The core job: push config down, pull logs up, from one place. Panorama pushes shared and device-group-specific configuration, plus dynamic content/software updates, out to every managed firewall, while pulling their logs back centrally for a fleet- wide view — the same two-directional flow, just running at fleet scale instead of one admin per box.
Why "shared" and "device-group-specific" config are two separate concepts, not one. Some policy genuinely applies everywhere (a corporate-wide block on known malware categories, say), while other policy is specific to one business unit or site. If everything were one flat config, you'd either duplicate the universal rules everywhere manually, or be unable to express the site-specific exceptions at all. Splitting into shared config (pushed to every firewall) plus device-group config (pushed only to a defined subset) solves both at once — and a local override on top of either still lets one specific firewall diverge from what Panorama pushed, when that's genuinely needed.
Why some advanced features flatly require Panorama, not just recommend it. HA-cluster provisioning, NGFW Clustering, and SD-WAN all coordinate state and configuration across multiple firewalls that have to agree with each other continuously — that coordination has to live somewhere, and building it into every individual firewall's local config would mean each one needing to know about every peer's state directly. Panorama is that somewhere: for these features it isn't a management convenience layered on top, it's the actual mechanism the feature is built on.
As an alternative to Panorama specifically, firewalls can instead be onboarded to Strata Cloud Manager for cloud-based management — a different product solving the same "manage a fleet from one place" problem, but hosted rather than self-operated.
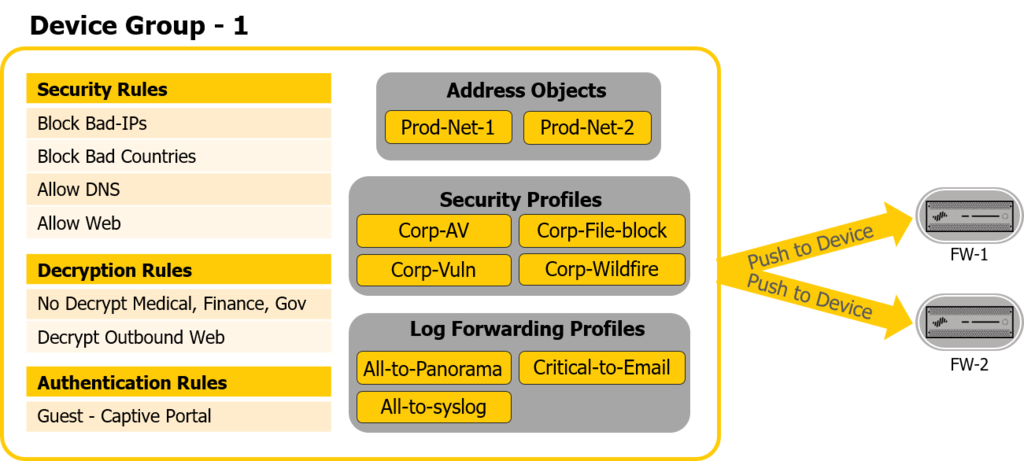
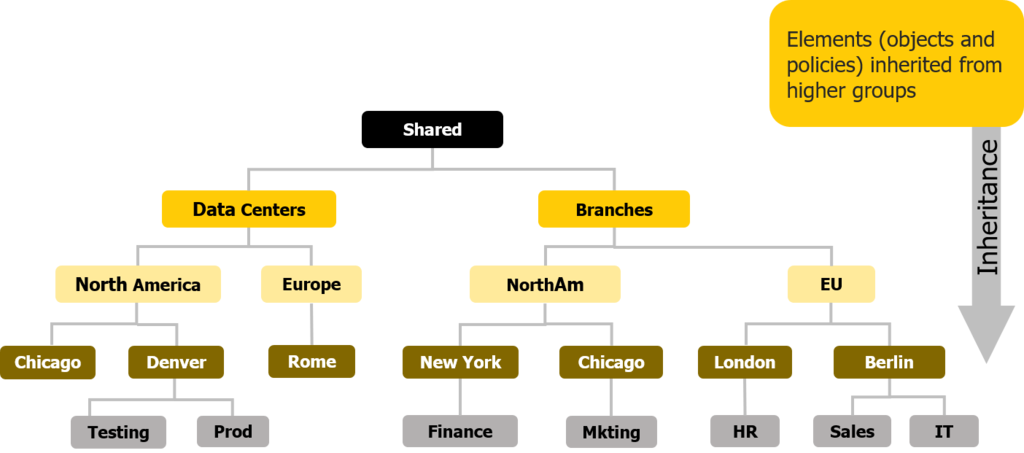
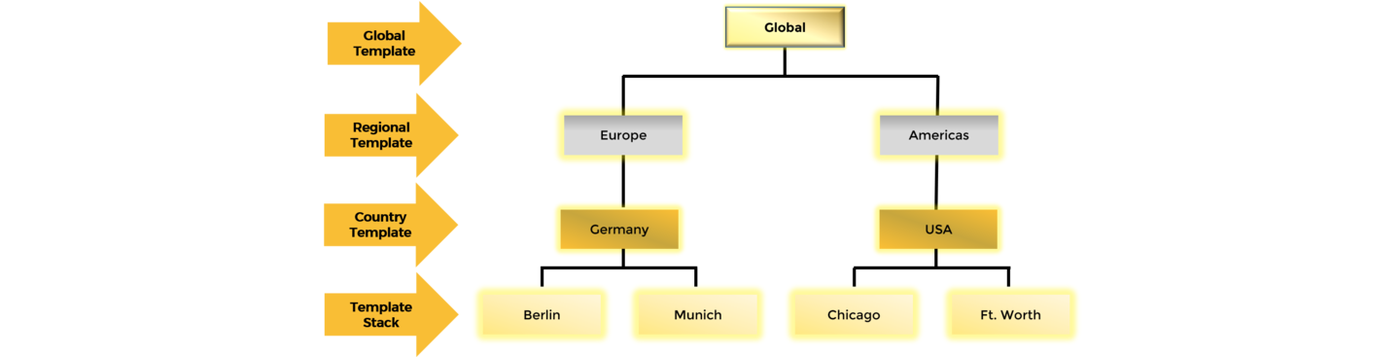
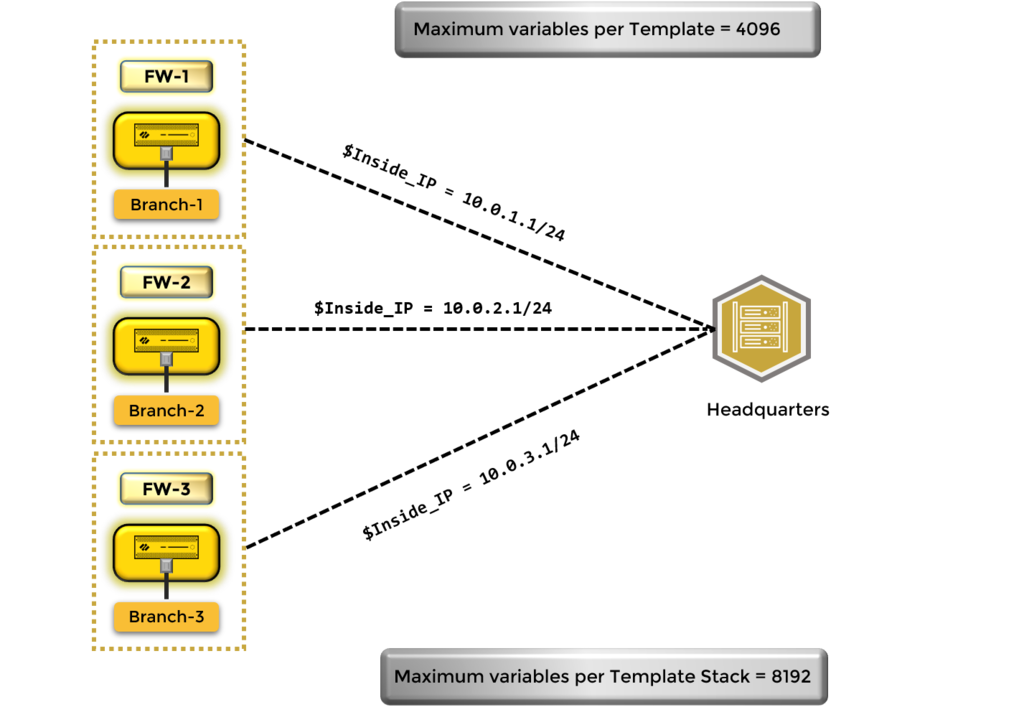
Diagrams: Palo Alto Networks Learning Center, Panorama course: Device groups; Panorama course: Templates in panorama. Click an image to enlarge.
Pros
- Single point for policy, licensing, and content/software update rollout across the whole fleet
- Required (or strongly recommended) for advanced features: HA-cluster provisioning, NGFW Clustering, SD-WAN, consolidated HA logging/ACC
- Device groups and templates let you reuse shared policy while allowing local overrides
Cons
- Becomes a second thing to size, patch, and keep highly available — itself a potential single point of failure
- Adds a layer of indirection (templates/device-groups/overrides) that has its own learning curve
- Version compatibility between Panorama and managed firewalls/plugins must be tracked for every feature (e.g. specific Panorama + Clustering Plugin versions for NGFW Clustering)
Watch: short GUI walkthroughs
Clips from the Palo Alto Networks Learning Center. They load only when you press play.
Exam trap
Panorama being "recommended" for basic multi-firewall policy management is an understatement for several features — HA-cluster provisioning, NGFW Clustering, and SD-WAN specifically require it. Don't assume any centralized feature is optional just because Panorama itself is a separate product.Self-check
Q1. You're deploying NGFW Clustering across a site. Do you need Panorama, and why?
Q2. A device group has a shared rule from Panorama and a local override on one firewall. Which one wins on that firewall?
Templates vs Device Groups, onboarding & deployment — exam drill
| Construct | Pushes |
|---|---|
| Templates / Template Stacks | Network and device settings: interfaces, zones, virtual routers, VLANs, IPSec/GRE tunnels, DNS/NTP, HA, log settings, management config. Template stacks layer multiple templates (global → regional → site) with lower templates overriding higher. |
| Device Groups | Policy rules and objects: security/NAT/decryption/PBF/QoS rules, address/service/app groups, security profiles. Device-group hierarchy lets a parent group's rules apply to child groups. Rules split into pre-rules (above local) and post-rules (below local). |
So: "consistent network/routing/interface config across sites" → template stacks. "Consistent security policy with regional variation" → device group hierarchy. An answer that swaps these (device groups for interfaces, templates for security policy) is wrong.
Onboard a firewall to Panorama: (1) on the firewall, set the
Panorama server IP(s) in Device > Setup > Management and
commit; (2) on Panorama, add the firewall by serial number,
then assign it to a Device Group and a Template Stack, and
commit + push. Optionally use Zero Touch Provisioning (ZTP) for hands-off
onboarding of new devices.
Panorama deployment: virtual appliance on ESXi, Hyper-V, KVM, AWS, Azure, or GCP, or an M-Series hardware appliance. Modes: Panorama (management + local log collection), Management-Only (no local logs — uses Dedicated Log Collectors or Strata Logging Service), and Log Collector mode (a Dedicated Log Collector node).
Locally-managed policies: to let local firewall admins keep making local rule changes while Panorama still pushes shared policy, rely on the pre-rule / local-rule / post-rule split (local rules sit between Panorama's pre and post rules) — don't fully lock the firewall out.
Cross-referenced from: ngfw/administration/high-availability, ngfw/administration/ngfw-clustering, pan-os/11-1/panorama-admin/manage-firewalls, panorama-admin/set-up-panorama/panorama-models; practice-set synthesis
Monitoring & Logging 51
Learning objectives
- Name the five main monitoring tools and what each is best used for
- Explain how ACC and ACE differ from raw log review
- Identify platform-specific monitoring caveats (e.g. PA-410)
Visibility tooling built on top of the firewall's logs: Dashboard, Application Command Center (ACC), Reports, the Automated Correlation Engine (ACE), and packet captures.
Why
Prevention isn't perfect — teams need fast visibility into traffic, threats, and system health to detect what got through and respond quickly.How
Five tools, each answering a different question you'd otherwise have to answer by hand from raw logs — which is the whole reason they exist as distinct tools instead of one generic "view logs" screen:
- Dashboard — "is the box itself healthy, right now?" At-a-glance status: software version, interface state, resource utilization. This is the first stop for system health, not traffic analysis.
- ACC (Application Command Center) — "what's actually happening across all this traffic, visually?" Interactive, filterable graphical summaries of log data — the tool for exploring patterns rather than reading log lines one at a time. Its "Compromised Hosts" widget specifically correlates multiple event types together to surface likely-infected systems, doing automatically what an analyst would otherwise piece together manually across several log types.
- Reports — "what's the trend over time, and who needs to see it regularly?" App Scope, Botnet, SaaS usage, User Activity, and custom reports track longer-term patterns rather than a point-in-time snapshot, and can be scheduled for email delivery — built for stakeholders who need periodic visibility without manually pulling data themselves.
- ACE (Automated Correlation Engine) — "what suspicious pattern would I have missed by reading logs manually?" Analyzes logs automatically for patterns that indicate compromise, doing at machine speed and scale what a human reviewing raw logs would likely miss or take too long to catch.
- Packet captures — "what exactly is on the wire, byte for byte?" The tool for deep troubleshooting when you need to see the actual packet contents, not a summarized log entry about them.
Underlying all of this: Traffic, Threat, and URL Filtering logs (among others) can be filtered, exported, or forwarded externally — the raw material every visualization tool above is ultimately built from.

Pros
- ACC correlates disparate log types into one investigative view instead of grepping raw logs
- ACE automates pattern detection across logs rather than relying purely on manual review
- Scheduled reports keep stakeholders informed without manual effort
Cons
- Meaningful long-term analysis needs adequate log storage sizing or external forwarding — easy to under-provision
- PA-410 specifically requires Panorama management just to get monitoring functionality
- Deep-dive investigation still requires an analyst who knows how to use ACC filters/pcaps effectively
| ACC Feature / Component | Description | Exam Critical Rules & Takeaways |
|---|---|---|
| Predefined Tabs | Network Activity, Threat Activity, Blocked Activity, Tunnel Activity, User Activity | Provide interactive graphical views. Global filters apply across all widgets on all tabs simultaneously. |
| Interactive Widgets | Compromised Hosts, Top Applications, High-Risk Users, Threat Activity by Country | Clicking any slice or bar in a widget automatically adds a global filter to narrow all other widgets. |
| Risk Meter (1–5) | Visual risk indicator based on application risk factor and active threats | Rates overall traffic risk level from 1 (lowest risk) to 5 (highest critical risk). |
| Log at Session End Dependency | CORE EXAM TRAP: ACC draws its metrics from logs written at session close | If data is missing from the ACC, verify that Log at Session End is enabled in the relevant Security Policies. If only Log at Session Start or no logging is checked, ACC metrics will remain blank! |
Watch: short GUI walkthroughs
Clips from the Palo Alto Networks Learning Center. They load only when you press play.
Exam trap
ACC and Reports summarize logged traffic — if a rule doesn't log (like the default intrazone/interzone-default rules), that traffic won't appear in either, even though it happened. "Not showing in ACC" is not proof traffic didn't occur.Custom reports, testing & quick blocks — exam drill
- Custom Report (
Monitor > Manage Custom Reports/ PanoramaMonitor > Reports): you choose a database to query — either a Summary database (Application Statistics, Traffic Summary, Threat Summary, URL Summary, Tunnel Summary, GTP/SCTP, etc. — pre-aggregated, fast, for trend/top-N reports) or Detailed Logs (Traffic, Threat, URL, Data Filtering, WildFire… — raw log rows, slower, for row-level detail). "Daily report of top high-risk applications by bandwidth" → Custom Report on the Application Statistics summary database, filter risk = 5, summarize by application. - Verify a rule before committing:
test security-policy-match
      from <zone> to <zone> source <ip> destination <ip> application
      <app> protocol <n>
shows which security rule the traffic would hit. Alsotest routing fib-lookup,test vpn ike-sa / ipsec-sa,show session all filter …for App-ID classification. - Immediately block an attacker IP for a set time without editing Security policy: use a block-IP list entry — e.g. set an Action of "Block IP" (track by source, for a duration) in a Vulnerability Protection / Anti-Spyware rule or a DoS/Zone Protection Reconnaissance action, or add the source to a block list from the threat log. This is enforced in hardware ahead of policy and expires automatically.
Self-check
Q1. Which tool would you use to see whether a specific host has an active session right now, independent of what's been logged?
Q2. A PA-410 admin says monitoring seems unavailable locally. What's the likely explanation?
Source: ngfw/administration/monitoring
Log Forwarding 52
Learning objectives
- Explain why logs are forwarded off-box rather than viewed only locally
- Trace the Log Forwarding profile → match-list → server-profile chain
- Identify the 4,096-byte truncation and unsupported-field crash risk
Any single firewall can only show logs for the traffic it saw — forwarding centralizes that visibility to Panorama or external tools instead of requiring an admin to log into every box individually.
Device > Log Settings (or a Log Collector Group), not a Log Forwarding Profile.Why
Multi-firewall environments make per-box log review impractical, and different teams often only care about a subset of logs (a SOC analyst wants WildFire-flagged Threat logs, not every Traffic log). Centralizing and filtering solves both problems at once.How
The chain, piece by piece — each link solving one specific part of "get the right log to the right place":
- Match-list profile — "which logs, filtered how?" Each one is scoped to exactly one log type (Traffic, Threat, WildFire Submission, URL Filtering, Data Filtering, Tunnel, Authentication), with an optional filter narrowing it further — this is the mechanism that lets a SOC analyst receive only WildFire-flagged Threat logs instead of drowning in every Traffic log the firewall generates.
- Server profile — "sent where, speaking what protocol?" Destinations include Panorama/Log Collectors, or external server profiles: SNMP trap, Email, Syslog, HTTP/S — each configured separately with its own certificate/authentication requirements, because each protocol has genuinely different security and delivery semantics.
- Log Forwarding profile — "the container tying match-lists to destinations." One or more match-list profiles, each with its own destinations, bundled into one profile (Objects > Log Forwarding) that can then be reused across multiple rules.
- Attachment — "what actually turns this on for real traffic?" The profile has to be attached to Security, Authentication, or DoS Protection rules (or, for System/Correlation/GlobalProtect/HIP Match/User-ID logs specifically, to zones via Device > Log Settings instead) — an unattached profile forwards nothing, the same "the object must be referenced by a rule" pattern that shows up with security profiles elsewhere in this guide. And specifically for Threat and WildFire Submission logs, the rule must also carry the relevant security profile (Vulnerability Protection, WildFire Analysis) — without that profile actually running, there's no threat/WildFire verdict for the match-list to forward in the first place.
Where the traffic physically goes, and why some platforms need special handling. By default, forwarded logs travel over the management interface — fine at moderate volume, but on genuinely high-throughput platforms (PA-7000/PA-7500/PA-5450 series), log volume itself can be enough to need a dedicated log interface or service route rather than sharing bandwidth with management traffic.
A Log Forwarding profile can also carry a built-in Quarantine action — wiring log forwarding directly into GlobalProtect device quarantine, so a matched log entry doesn't just get recorded somewhere, it can trigger an automated containment action.
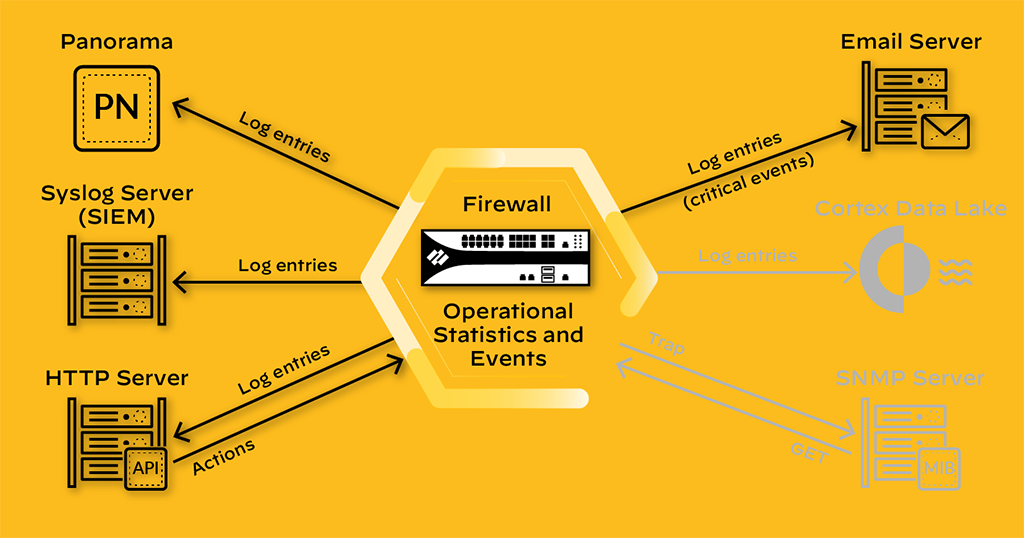
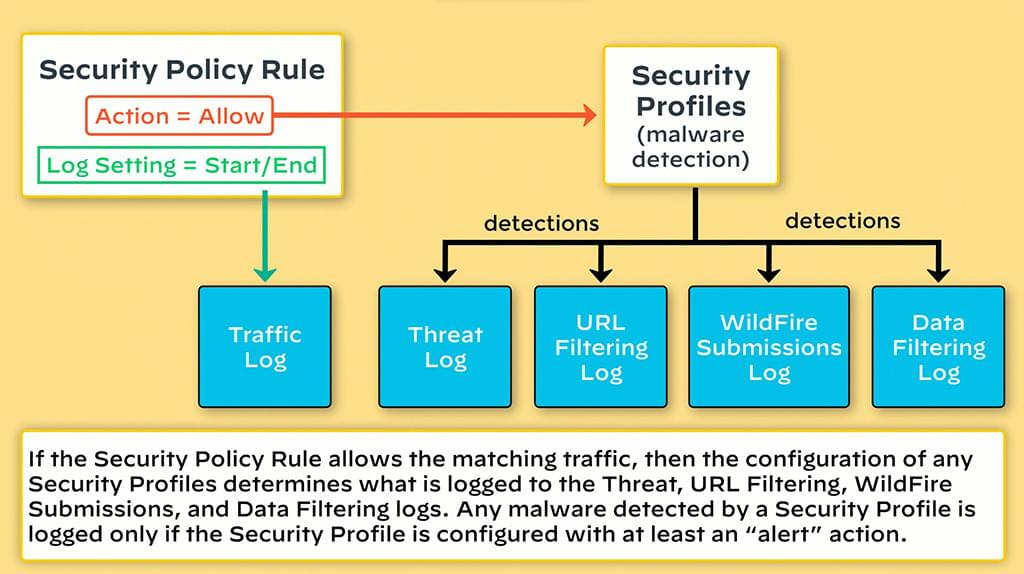
Diagrams: Palo Alto Networks Learning Center, PAN-OS course: Log forwarding; PAN-OS course: Threat and traffic logs. Click an image to enlarge.
Pros
- Per-log-type filtering means teams only receive the logs relevant to their job
- Multiple destination types (Panorama, SNMP, Email, Syslog, HTTP/S) fit almost any existing SIEM/monitoring stack
- Built-in Quarantine action wires log forwarding directly into automated response
Cons
- Forwarded log records are truncated at 4,096 bytes — large log entries silently lose data past that limit
- Forwarding logs with unsupported fields/pseudo-fields can crash the firewall — a sharp, non-obvious failure mode
- HTTP/S forwarding is explicitly not recommended for high-volume deployments — log loss is a real risk at scale
- High-throughput hardware (PA-7000/7500/5450) needs dedicated log interfaces/cards — this isn't just a software toggle on those platforms
Watch: short GUI walkthroughs
Clips from the Palo Alto Networks Learning Center. They load only when you press play.
Exam trap
Attaching a Log Forwarding profile to a Security rule is not enough on its own for Threat or WildFire Submission logs — the rule must also carry the relevant security profile (e.g. a Vulnerability Protection or WildFire Analysis profile), or there's nothing for that match-list to forward.Self-check
Q1. A large log entry appears truncated in your SIEM after forwarding. What's the most likely cause?
Q2. Why might HTTP/S be a poor choice as the sole forwarding destination for a high-volume PA-7500 deployment?
📋 Cheat Sheet — Log Forwarding Domain 2.3
- 5 destination types: Panorama, Syslog, SNMP, Email, HTTP/S
- Default: logs forward over MGT interface unless service route configured
- Max log record: 4,096 bytes (truncated if larger)
- Threat logs: require a security profile attached to the rule
- PA-7000 with Log Cards: configure log card interface for forwarding
Source: ngfw/administration/monitoring/configure-log-forwarding
Strata Logging Service 53
Learning objectives
- Explain what Strata Logging Service replaces and why
- Identify which other services depend on it
Strata Logging Service is Palo Alto's cloud-based, multi-tenant log storage and analytics back end — the destination that lets you retire on-box/on-prem log storage capacity planning entirely and get essentially unlimited, centrally-searchable retention instead.
Why
On-box log storage is finite and platform-dependent (smaller appliances fill up fast under heavy logging), and building out on-prem Log Collector infrastructure to scale storage is its own project. A cloud-native, elastically-scaled log store removes that capacity-planning burden and gives every managed firewall the same retention/search experience regardless of its own hardware.How
Mechanically, it's just another forwarding destination — that's deliberate. Firewalls (and CN-Series, per CN-Series Architecture) forward logs to Strata Logging Service the exact same way they'd forward to Panorama or any other log-forwarding destination, once licensed — no separate forwarding mechanism to learn, and (per the exam trap below) the same constraints like 4,096-byte truncation still apply, since it's reached through that identical pipeline rather than some special cloud-only path.
Why it's more than "cloud storage for logs" — it's load-bearing infrastructure for several other features. Once logs land there, several other cloud-delivered capabilities read from that same store instead of maintaining their own separate log pipeline: Device Telemetry uploads feed it, Panorama and Strata Cloud Manager query it for centralized reporting instead of aggregating logs from individual on-prem Log Collectors themselves, and it's the underlying log store for Cloud NGFW deployments entirely. This is why the exam trap below matters: it isn't a standalone convenience feature, other things actually depend on it.
Why licensing is account-wide rather than per-device. Because it's a multi-tenant cloud service tied to your support account rather than provisioned per physical box, buying one Strata Logging Service license automatically extends coverage to every firewall registered under that account — including CN-Series instances, which have no "hardware" of their own to license storage against individually.
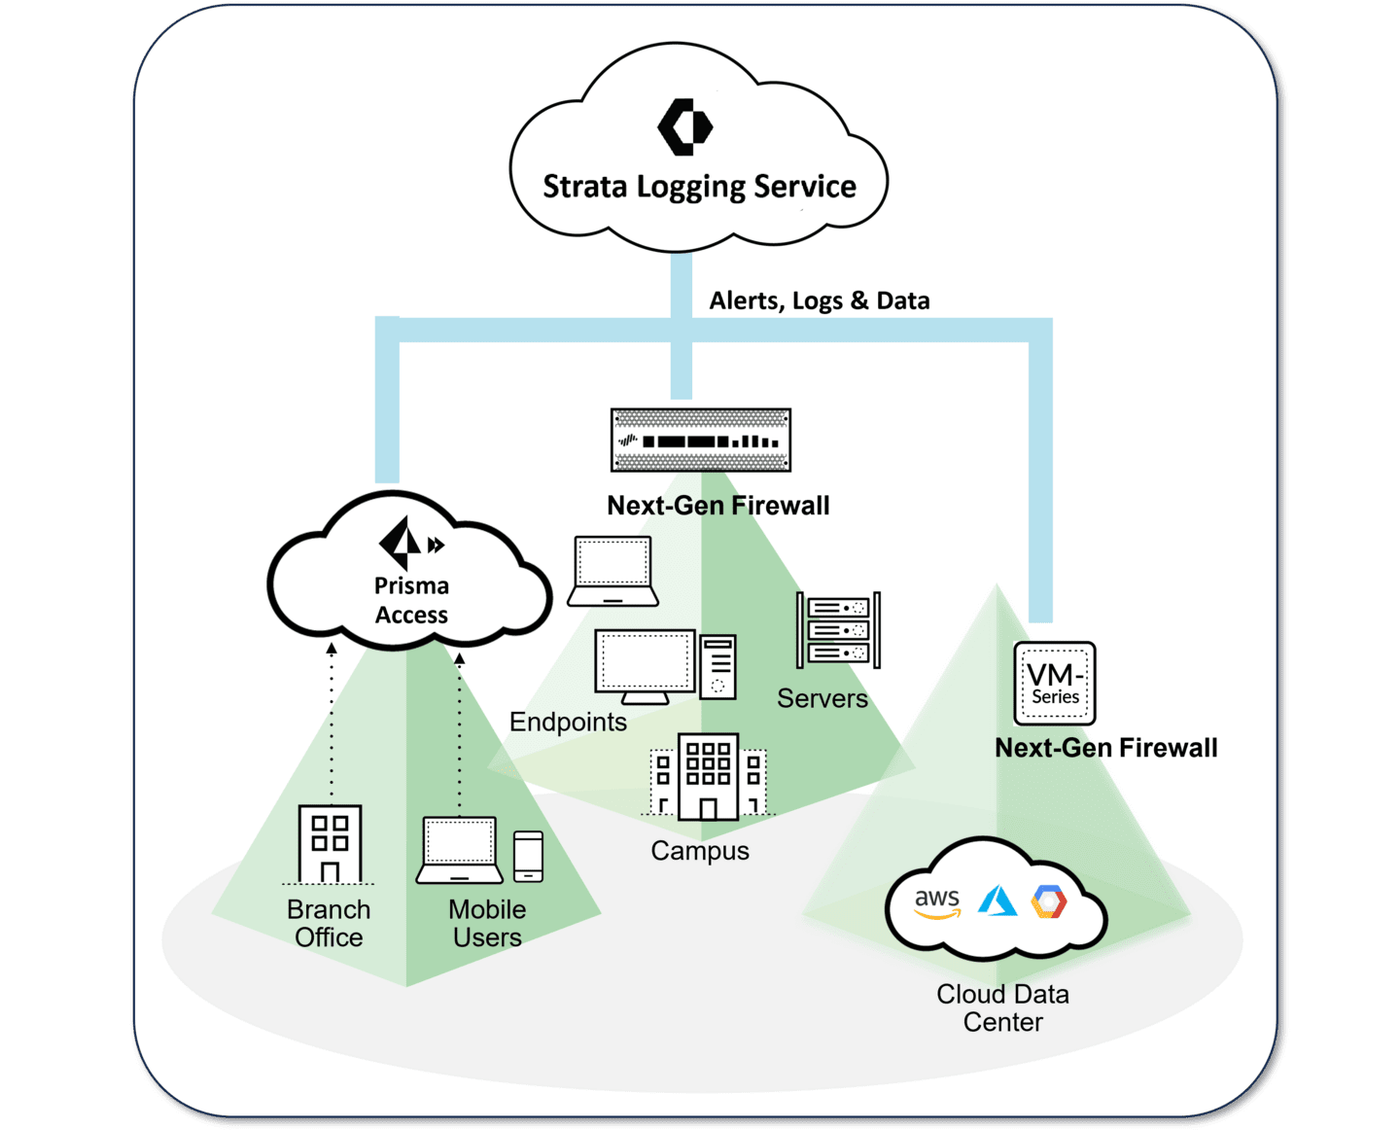
Diagrams: Palo Alto Networks Learning Center, PAN-OS course: Strata logging service features. Click an image to enlarge.
Pros
- Removes on-box/on-prem log storage capacity planning entirely
- One license covers every firewall on the support account, including CN-Series
- Underpins several other cloud-delivered management/telemetry features rather than being a standalone silo
Cons
- Introduces a cloud dependency for something as core as log retention/search
- Separate licensing line item on top of core NGFW/Panorama costs
- Same 4,096-byte-record and unsupported-field constraints as any other forwarding destination still apply
| Step | Configuration Action | Core Requirement & Exam Rule |
|---|---|---|
| 1. FQDN Access | Allow outbound HTTPS to Palo Alto cloud endpoints (api.paloaltonetworks.com, etc.) |
DO NOT DECRYPT this traffic in SSL Forward Proxy rules! Decryption breaks mutual cloud certificate validation. |
| 2. Proxy (Optional) | Configure proxy under Device > Setup > Services |
Specify upstream proxy IP, port, and credentials if direct internet is blocked. |
| 3. Enable Logging | Device > Setup > Management > Cloud Logging |
Check Enable Cloud Logging and select geographical region for regulatory compliance. |
| 4. Log Forwarding | Attach Log Forwarding Profile to Security Rules | Select Panorama / Strata Logging Service destination. Max log record size is 4,096 bytes. |
| 5. Duplicate Logging | Enable duplicate logging if evaluating cloud storage | Forwards logs simultaneously to both Strata Logging Service and on-premises Panorama Log Collectors. |
CLI Status & Certificate Fetch Commands
Exam traps
- Strata Logging Service doesn't remove the log-forwarding constraints — the same 4,096-byte record truncation and unsupported-field crash risk still apply, because it's reached via the same forwarding mechanism as any other destination.
- To send logs to Strata Logging Service you configure a Log Forwarding Profile with the Panorama/Strata Logging Service destination and attach it to security rules — and onboard the firewall to the Strata Logging Service tenant.
- After onboarding to Strata Logging Service, new logs stop appearing on Panorama's own Log Collectors unless you also keep the "forward to Panorama / retain on-prem" option enabled — there's a setting under
Device/Template > Setup > Management > Logging Serviceto send to both. - Logs in Strata Logging Service can be retrieved via API queries for SIEM/SOAR integration — they are not "only visible in Panorama".
Self-check
Q1. Why does buying one Strata Logging Service license cover every firewall on the support account, including CN-Series?
Q2. Which two other features/services covered in this guide depend on Strata Logging Service as their back end?
Curriculum: PAN-OS course, "Strata Logging Service Features" lesson; Palo Alto Next-Gen Firewall (NGFW) Master Cheat Sheet Domain 2.3
Reading Traffic Logs — Deep Dive 54
Learning objectives
- Identify the scope of information available within a single Traffic log entry
- Match column display on Monitor > Logs > Traffic to your troubleshooting needs
- Use filters to find and display the logs you need
- Distinguish potentially misleading information from legitimate diagnostic indicators
Traffic logs are really session logs — most troubleshooting questions ("did this get allowed," "why did this connection end," "is this even reaching the firewall") can be answered by knowing how to read them correctly, before ever reaching for a packet capture.
Why
A "level-appropriate methods" approach — start with the highest-level tool that answers the question — saves enormous troubleshooting time. If a Traffic log entry already contains the answer, running a packet capture or standing up a custom diagnostic rule is wasted effort and a wasted change-window.How
Each entry is a data dump from the session-setup process (a calculated allow/deny outcome per Security Policy) plus later session-table updates from application shifts or policy rematches. Several fields are commonly misread because their name implies more than they actually tell you — each one below is worth internalizing precisely:
- Log type ("drop", "start", "end") — tells you when the log was generated, nothing about content-inspection results. A "drop" log means the session-setup process denied the session before a session table entry was even created (always Session ID 0) — there was never really a "session" to speak of. An "end" log is generated once per session regardless of whether that session was clean, blocked mid-session by a security profile, or denied by policy — "end" alone tells you the session concluded, not how.
- Action column (allow/deny/drop/reset-client/reset-server/reset-both) — reflects the Security Policy verdict only. "Allow" traffic can still be blocked afterward by a Threat or URL Filtering profile running on that same allowed session — so "allow" alone never means "clean," only "Security Policy didn't reject it outright."
- Session End Reason — shows only the single highest-priority cause when multiple causes were involved. Has to be read alongside other fields rather than taken at face value — "aged-out," for instance, is simply expected/normal behavior for UDP and ICMP (which have no explicit close handshake the way TCP does), not necessarily a sign of a problem.
- "No logs" — does not mean "no traffic." Logs are generated per Security Policy rule's own logging configuration, and the built-in intrazone-default and interzone-default rules don't log by default. Traffic matching those default rules simply leaves no trace unless someone explicitly turned logging on for them.
What actually answers "is this happening right now," independent of any logging configuration: the live, filterable Session Browser — it reflects the session table directly, so it shows active sessions regardless of whether the matching rule logs at all.
Practical navigation tips that matter at scale: with 100+ available columns on PAN-OS 10.1+, the default column set is intentionally generic rather than tuned to any specific investigation — customize which columns display to match your actual troubleshooting question. And build filters by clicking individual field values (a timestamp, an IP) rather than hand-typing filter syntax — letting the UI construct the correct syntax avoids a common source of filter typos.

Pros
- Traffic logs alone resolve most connectivity/rule-matching questions without a packet capture
- Session Browser gives live visibility independent of whatever logging is configured on the matched rule
- Column customization and click-to-filter make large log volumes practically searchable
Cons
- "Allow" action and "no logs" are two of the most commonly misread signals — both require the analyst to know what they don't mean
- Default intrazone/interzone-default rules not logging by default is a common blind spot until explicitly overridden
- 100+ possible columns means the useful ones have to be deliberately configured — the out-of-the-box view isn't tuned for any specific investigation
Exam trap
"Allow" in the Action column and "no logs at all" are the two most commonly misread signals — "allow" only reflects the Security Policy verdict (a Threat/URL Filtering profile can still block after that), and "no logs" can simply mean the matching rule (often intrazone/interzone-default) isn't configured to log, not that no traffic occurred.Self-check
Q1. A Traffic log entry shows Session ID 0 and Log Type "drop." What does that tell you about when the session table was involved?
Q2. Session End Reason shows "aged-out" for a UDP session. Is that a red flag?
Source: G:\NGFW\001-Reading Traffic Logs.md (standalone course export, 5 lessons: Traffic Logs Key Concepts, Troubleshooting Methodology, Searching and Displaying Logs, Detailed Log View, Correction to Common False Assumptions).
Device Telemetry 55
Not in the exam blueprint. Optional reading, click to expand.
Learning objectives
- Identify the broad categories of data Device Telemetry collects
- Explain how telemetry uploads feed Palo Alto's threat-intelligence and ML detection models
- Know what administrator controls exist over collection and inspection of telemetry data
Collects operational data about the firewall/Panorama and uploads it to Strata Logging Service to power telemetry-driven apps and Palo Alto's threat-intelligence sharing.
Why
Both the customer (proactive monitoring/AIOps) and Palo Alto (aggregate threat intelligence) benefit from continuous device health and usage data rather than point-in-time snapshots. Detection models — including WildFire and Advanced Threat Prevention's cloud-based ML classifiers — are only as good as the population of data they're trained and tuned against, so telemetry from the installed base is part of what keeps those services effective against new threats rather than static after release.How
What actually gets collected — and the boundary that matters most for data governance. Data is gathered on defined intervals and transmitted to Strata Logging Service, grouped into a few specific categories:
- Product usage — feature adoption, resource utilization
- Device health — system/hardware status, crash and error data
- Threat/application data — App-ID and Threat Prevention statistics
Critically, this is not full packet or session-content capture — telemetry is operational/statistical data about how the device is behaving and performing, not a copy of the actual traffic it inspected. That distinction is exactly what the exam trap below is testing, and it's also the practical answer to "is this a privacy/data-exfiltration risk": it structurally can't leak session contents because it was never collecting them.
Why administrators get fine-grained control over this specifically. Sending any operational data to a vendor is the kind of thing that can trip an internal data-governance review, so administrators can manage collection at a per-category level (turn off just the categories that concern them, rather than all-or-nothing), monitor the telemetry pipeline itself for delivery status, and — the detail that actually resolves most governance concerns — inspect samples of the actual data being sent before or while it's transmitted. Being able to see exactly what leaves the box, rather than trusting a vendor's description of it, is what lets a security team sign off on enabling this in a regulated environment.

Pros
- Feeds AIOps-style proactive health/anomaly monitoring apps
- Contributes to community-wide threat intelligence
- Collection/transmission intervals and content are administrator-configurable and inspectable
Cons
- Requires a Strata Cloud Manager license tier (Essentials or Pro) to fully use
- Data-sharing-to-vendor nature may require review against internal data-governance/compliance policy
Exam trap
Device Telemetry uploads operational/health/usage data to Strata Logging Service — it is not full packet or session-content capture, and it's a distinct data flow from the Log Forwarding profiles covered earlier in this module.Self-check
Q1. Your org's data-governance policy requires reviewing exactly what's sent to a vendor before enabling a feature. What lets you do that for Device Telemetry?
Q2. Why does Palo Alto benefit from telemetry beyond just the customer's own AIOps monitoring?
Source: pan-os/11-1/pan-os-admin/device-telemetry
Platform Security — Integrity Measurement Architecture 56
Not in the exam blueprint. Optional reading, click to expand.
Learning objectives
- Explain what IMA protects against that network-layer inspection cannot
- Describe the two configurable violation responses and when each is appropriate
Built-in protections that harden PAN-OS itself against tampering — not traffic inspection, but defense of the firewall's own runtime integrity.
Why
A firewall is a high-value target; if the platform's own binaries can be modified or malware executed on the appliance itself, every downstream security control is compromised.How
What problem this solves that firewall rules structurally cannot. Every other feature in this guide inspects network traffic passing through the box — but none of that helps if an attacker manages to get malicious code actually running on the firewall itself (via a compromised update, a supply-chain issue, or physical/management access). At that point, the attacker isn't traffic to inspect, they're inside the thing doing the inspecting. IMA exists specifically to defend against that different threat model.
How it actually enforces this — extending trust from boot into runtime. Secure boot already verifies the firewall's boot chain hasn't been tampered with before the OS starts. IMA (Integrity Measurement Architecture) extends that same idea into the running system: in its default enforcement mode, it allows execution only of binaries cryptographically signed by Palo Alto Networks. An unsigned or modified binary — the signature a legitimate attacker's payload would lack — simply cannot execute, regardless of how it got onto the box.
Two different responses to a violation, deliberately configurable rather than fixed. When IMA catches a violation, it always logs it as a critical system event — but what happens next is a genuine operational tradeoff: PAN-OS can either keep running and just log it (the default, prioritizing uptime), or reboot to maintenance mode specifically to disrupt an active attacker mid-attempt (prioritizing containment over availability). The default being log-only, not reboot, is deliberate — an automatic reboot on every violation would itself be a potential availability risk if a violation were ever a false positive, so the more disruptive response is opt-in for environments that genuinely prioritize stopping an active compromise over staying up.
Underpinning all of this: software integrity checks run at boot and again on a daily, admin-configurable schedule — not just a one-time check when the device first powers on, but an ongoing verification that nothing has changed since.

Pros
- Blocks execution of unsigned/tampered code at the platform level, not just network level
- Enforcement is on by default — no extra configuration needed to get baseline protection
- Configurable response (log-only vs. reboot-to-maintenance) fits different operational risk tolerances
Cons
- Only available on PAN-OS 12.1 and later — not a benefit on older deployed code
- Reboot-to-maintenance response, if misapplied, could itself be leveraged for a disruption/DoS scenario against the firewall
Exam trap
IMA's default enforcement response is log-only, not reboot — don't assume a violation automatically disrupts the firewall; the reboot-to-maintenance response has to be deliberately configured for environments that prioritize stopping an active attacker over uptime.Self-check
Q1. An unsigned binary attempts to execute on a PAN-OS 12.1 firewall with IMA enforcement on. What happens?
Q2. Is IMA a network-traffic control?
Source: ngfw/administration/security-settings
PAN-OS Software Updates — Upgrade & Downgrade 57
Learning objectives
- Explain the sequential base-image upgrade path rule and why you can't skip straight to a target release
- Describe the correct order of operations for upgrading an HA pair without causing an outage
- Distinguish upgrade/downgrade caveats — especially the config-restore requirement across feature releases
Upgrading PAN-OS is a planned, sequenced operation — not a single "click install" — and getting the order wrong on an HA pair, or the version-path wrong on a multi-release jump, is one of the more operationally dangerous mistakes a firewall admin can make.
Why
A firewall carries live traffic and, in HA, a peer whose state must stay synchronized. PAN-OS enforces a structured upgrade path (rather than allowing an arbitrary jump from any version to any other) because each feature release can carry config-schema and behavioral changes that only get validated against the immediately preceding release — and HA upgrade order exists specifically to avoid a moment where both peers, or neither peer, is passing traffic.How
Content updates vs. software updates — two different things. App/Threat content updates (signatures, App-ID definitions) are separate, frequent, typically-automatic downloads that don't change the PAN-OS version itself. A PAN-OS software update is a full version change (a maintenance release like 11.1.2, or a feature release like 11.1.0) and follows its own upgrade checklist and path — conflating the two is a common beginner mistake worth ruling out early.
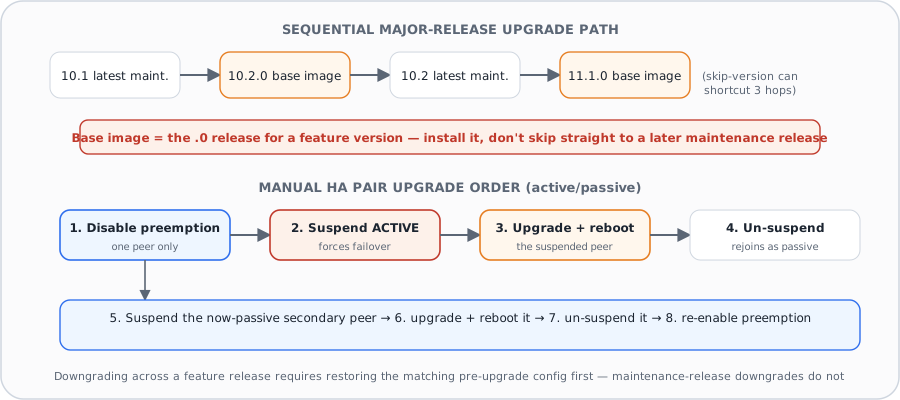
The base-image rule: install the .0 release before any later
maintenance release in that feature line. Palo Alto's documented upgrade path
pattern is: install the latest preferred maintenance release of your current feature
version, then download the base image (the .0 release, e.g. 11.1.0) of
the next feature version, then install and reboot on that base image before applying any
later maintenance release within that new line. You do not skip straight to, say, 11.1.3
without first landing on 11.1.0 — this base-image-first requirement is exactly the kind of
specific rule an exam question tests literally ("must install 11.1.0 before 11.1.2" is true;
going directly to 11.1.2 is not supported). The Skip Software Version
feature (available for devices already on 10.1 or later) lets you jump up to three feature
versions ahead in one step, but it doesn't remove the underlying sequential-path logic — it
automates walking it.
HA pair upgrade order — one peer at a time, passive first. Palo Alto's documented manual procedure for active/passive HA is: install and reboot the upgrade on the passive (active-secondary) peer first; once it is back up and healthy, suspend the active peer so traffic fails over to the freshly-upgraded former passive; then upgrade the former-active peer; then return it to service (fail back only if preemption is enabled). Disable preemption before starting so the upgrade-induced failover doesn't trigger an unwanted failback partway through. (Some older training material states "active first" — the current documented order is passive/secondary first, and the dump questions expect passive-first.) For active/active, upgrade one peer at a time; order doesn't matter functionally. PAN-OS 12.1.2+ adds an Orchestrated Upgrade option that automates this entire sequence (upgrades the passive peer first, reboots it, triggers failover, then upgrades the other peer) after pre-checks confirm both firewalls are Panorama-managed, config-synchronized, and HA-healthy.
Downgrade — maintenance-release downgrades are simple, feature-release downgrades are not. Downgrading within the same feature release (e.g. 11.1.2 → 11.1.0) requires no special config handling. Downgrading across a feature release (e.g. 11.1.x → 10.2.x) is materially different: because the newer release's candidate/running config may use schema or features the older release doesn't understand, you must first restore the configuration that matches the target (older) release before downgrading — skipping this step risks a failed downgrade or the firewall entering maintenance mode. If a downgrade goes wrong, recovery may require entering maintenance mode, factory-resetting, and restoring from the config backup taken before the original upgrade — which is exactly why exporting a named configuration snapshot is a mandatory first step in every documented upgrade procedure, not just a nice-to-have.
Pros
- The one-peer-at-a-time HA order (passive/secondary first, then fail over, then former active) lets an admin upgrade with zero planned downtime if executed correctly
- Skip Software Version collapses up to three feature-release hops into one guided jump
- Orchestrated Upgrade (12.1.2+) removes most manual steps and adds automated pre-checks for HA pairs
Cons
- Getting the base-image sequencing wrong (skipping straight to a later maintenance release) is not supported and can leave a device unable to complete the upgrade
- Feature-release downgrades require restoring a matching older configuration first — an easy step to forget under time pressure
- Failing to disable preemption before an HA upgrade risks an unwanted failback mid-procedure
Exam Trap
For an active/passive HA upgrade, the order is passive/active-secondary first, then fail over, then the former active. Before upgrading anything: download the target image and export a named configuration snapshot / back up the running config — those are the two mandatory pre-steps (not "disable all security policies", not "check third-party VPN clients"). Also don't confuse a PAN-OS software upgrade with an App-ID/Threat content update.
Self-check: PAN-OS Software Updates
Content Update Scheduling — a different knob from the PAN-OS upgrade path above
Everything above governs the PAN-OS version. A separate setting — Device >
Dynamic Updates > Schedule — governs how soon a downloaded Applications and Threats
content release actually gets installed, via an install Threshold
(a delay window, in hours, between download and install). Palo Alto documents two opposite
reference profiles for that threshold, and the exam trap is assuming "mission-critical" means
"install fastest" — it's the reverse.
- Security-first profile: a 6–12 hour threshold. The priority here is closing the exposure window against new threats as fast as is reasonably safe, so the delay is kept short — new coverage goes live within half a day of release.
- Mission-critical profile: up to a 48 hour threshold. The priority flips — for a network with zero tolerance for application downtime, an immature signature that misfires (a false-positive blocking a business-critical app) is a worse outcome than a threat going uncovered for another day and a half. The longer delay lets the content release "bake" in the field on other customers' firewalls first, so any bad signature gets caught and pulled before it ever reaches this network. Slower rollout is the deliberate safety mechanism, not an oversight.
- New App-ID threshold is a separate, coarser control from the general content threshold — it delays only the content releases that introduce new or changed App-IDs (which ship on a monthly cadence), giving time to review and adjust Security policy before an App-ID's classification shifts under a rule that depends on it.
📋 Cheat Sheet — Software Updates Domain 2.4
- Process: Download → Upload → Install (requires reboot)
- HA pairs: use 'install and reboot' with delayed reboot to avoid both offline
- Always test in lab first, have rollback plan (config backup)
⌨️ CLI Verification
| Command | Purpose |
|---|---|
show system info | check version |
request system software install version <ver> | install specific version |
Source: pan-os_11-1_pan-os-upgrade_upgrade-pan-os_upgrade-the-firewall-pan-os.md; pan-os_11-1_pan-os-upgrade_upgrade-pan-os_upgrade-the-firewall-pan-os_determine-the-upgrade-path.md; pan-os_11-1_pan-os-upgrade_upgrade-pan-os_upgrade-the-firewall-pan-os_upgrade-an-ha-firewall-pair.md; pan-os_11-1_pan-os-upgrade_upgrade-pan-os_downgrade-pan-os.md; pan-os_11-1_pan-os-upgrade_upgrade-pan-os_pan-os-upgrade-checklist.md
Log Collectors & Distributed Log Collection 58
Learning objectives
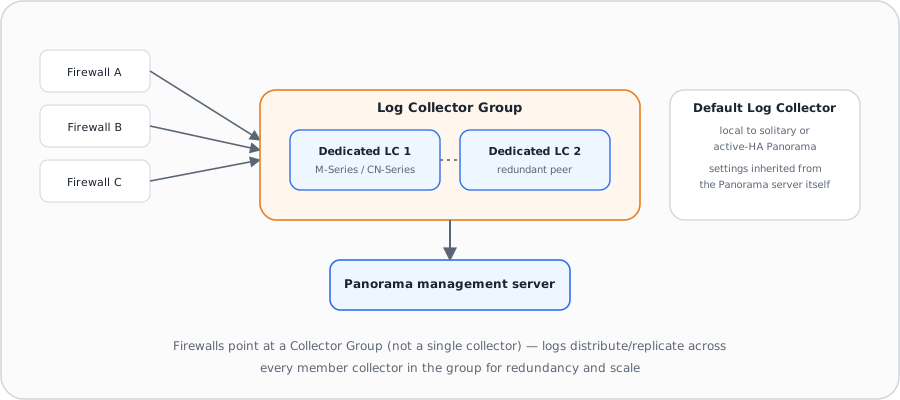
- Distinguish a Dedicated Log Collector from Panorama's built-in (default) Log Collector
- Explain what a Log Collector Group is for and why firewalls point at a group rather than a single collector
- Identify the settings that differ between a local vs. remote/dedicated collector configuration
Log forwarding and Strata Logging Service above cover where logs go conceptually; at scale, on-premises deployments need dedicated infrastructure to actually store and serve that log volume — that's the role of Log Collectors and Log Collector Groups.
Why
A large fleet of firewalls generates more log volume than any single appliance can reliably store or search, and a single point of log storage is a single point of failure for compliance/forensic visibility. Distributed, redundant log collection exists to solve both the scale problem and the availability problem at once.How
Three collector configurations, not one uniform model. When you add a Log
Collector under Panorama > Managed Collectors, what you configure depends on
where it physically lives: a Dedicated Log Collector (a separate M-Series or
CN-Series appliance) requires entering its serial number, after which its Interfaces tab
becomes available for full configuration — management traffic, Collector Group
communication, and log-collection interfaces are all configured independently on it. The
default Log Collector local to a solitary or active-HA Panorama management
server, by contrast, only exposes Disks, Communication, and a subset of General settings — it
inherits everything else directly from the Panorama server's own configuration, since it's
running on the same box. In an HA Panorama deployment, the default collector local to the
passive Panorama peer is treated as remote and must be configured like a
Dedicated Log Collector — an easy detail to overlook since it "feels" local but isn't treated
that way.
General settings identify the collector and its upstream dependencies. Beyond the required Collector S/N and a unique Collector Name (which becomes its hostname), general settings define the Panorama Server IP (and a secondary IP for an HA Panorama pair), domain, primary/secondary DNS, primary/secondary NTP, timezone, and even latitude/longitude (used by traffic/threat map visualizations). A Dedicated Log Collector also needs its own RAID disk configuration for actual log storage and its own interface settings for management/collection traffic — none of which apply to Panorama's local default collector, since that traffic already rides Panorama's own interfaces.
Log Collector Groups are what firewalls actually target — not individual collectors. A firewall's log forwarding configuration points at a Collector Group, which can contain up to 16 Log Collectors — a hard platform ceiling worth memorizing exactly, since "how many collectors can one group hold" is an easy one-line question. When a group has multiple member collectors, logs distribute and can be configured for redundancy across them, so the loss of a single collector doesn't mean losing that portion of log history — this redundancy is the entire operational reason to run more than one Dedicated Log Collector rather than a single, larger one. That said, redundancy has a real cost: turning it on doubles the log-processing traffic inside the group (every log gets replicated to a second collector), which halves the group's effective maximum logging rate — a tradeoff to weigh against how much log loss is actually tolerable. Log Collector software updates are themselves managed and pushed from Panorama, and — critically for upgrade sequencing — Log Collectors must be upgraded before the firewalls that forward to them, following the same "upgrade upstream/central components first" logic that applies to Panorama itself.
Pros
- Log Collector Groups give log storage redundancy — one collector's loss doesn't mean lost log history
- Dedicated Log Collectors scale log storage/search independently of Panorama's own management-plane sizing
- Panorama's local default collector needs almost no separate configuration, simplifying small deployments
Cons
- Dedicated Log Collectors need full independent configuration (interfaces, RAID, NTP/DNS) that a local default collector doesn't
- The passive-Panorama-peer default collector is deceptively "remote" in configuration terms despite sitting on the HA passive box
- Upgrade ordering discipline (Log Collectors before firewalls) adds another dependency to plan around during a fleet-wide upgrade
Exam Trap
Don't assume every Log Collector configuration looks the same — a question describing a "Log Collector" that only exposes Disks/Communication/General settings (no Interfaces tab) is describing Panorama's own local default collector, not a Dedicated Log Collector. And don't forget: in Panorama HA, the passive peer's local collector is configured as remote/dedicated, not as a second "local" collector.
Self-check: Log Collectors & Distributed Log Collection
Source: ngfw_help_11-1_panorama-web-interface_panorama-managed-collectors_log-collector-configuration.md; ngfw_help_11-1_panorama-web-interface_panorama-managed-collectors_log-collector-configuration_general-log-collector-settings.md; ngfw_help_11-1_panorama-web-interface_panorama-managed-collectors_software-updates-for-dedicated-log-collectors.md
Panorama Pre-Rules, Post-Rules & Rulebase Ordering 59
Learning objectives
- State the full rule evaluation order across Pre Rules, local firewall rules, Post Rules, and default rules
- Explain why Pre Rules and Post Rules exist as separate layers instead of one shared rulebase
- Describe how shared vs. device-group-scoped rules interact with this ordering
When firewalls are managed by Panorama, the effective rulebase a given firewall enforces isn't just what's configured locally on that box — it's a layered composite of rules defined on Panorama itself, and the order those layers are evaluated in is a specific, fixed sequence.
Why
A large organization needs to guarantee certain policies — an acceptable-use baseline, a mandatory default-deny cleanup rule — apply everywhere, consistently, without relying on every local firewall admin to configure them correctly (or refrain from silently removing them). Splitting the rulebase into a centrally-controlled layer that wraps around a locally-editable layer achieves this without removing local admins' ability to add their own site-specific rules in between.How
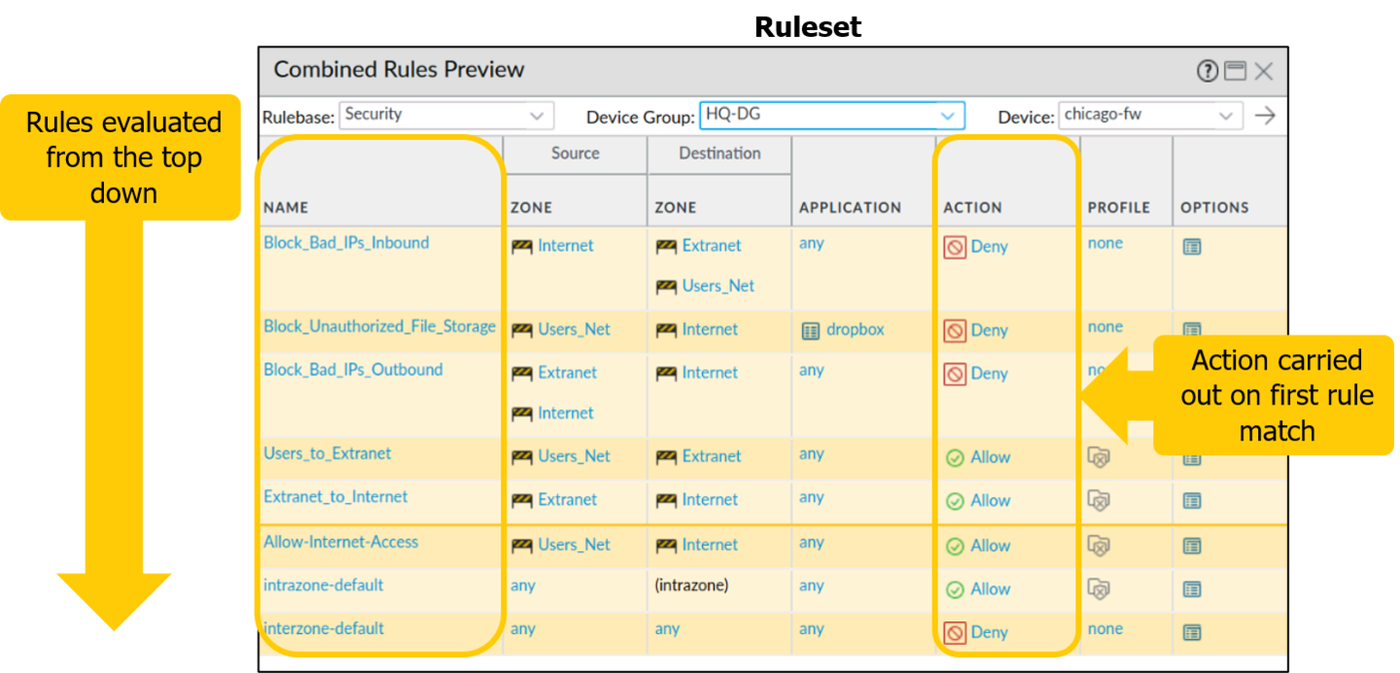
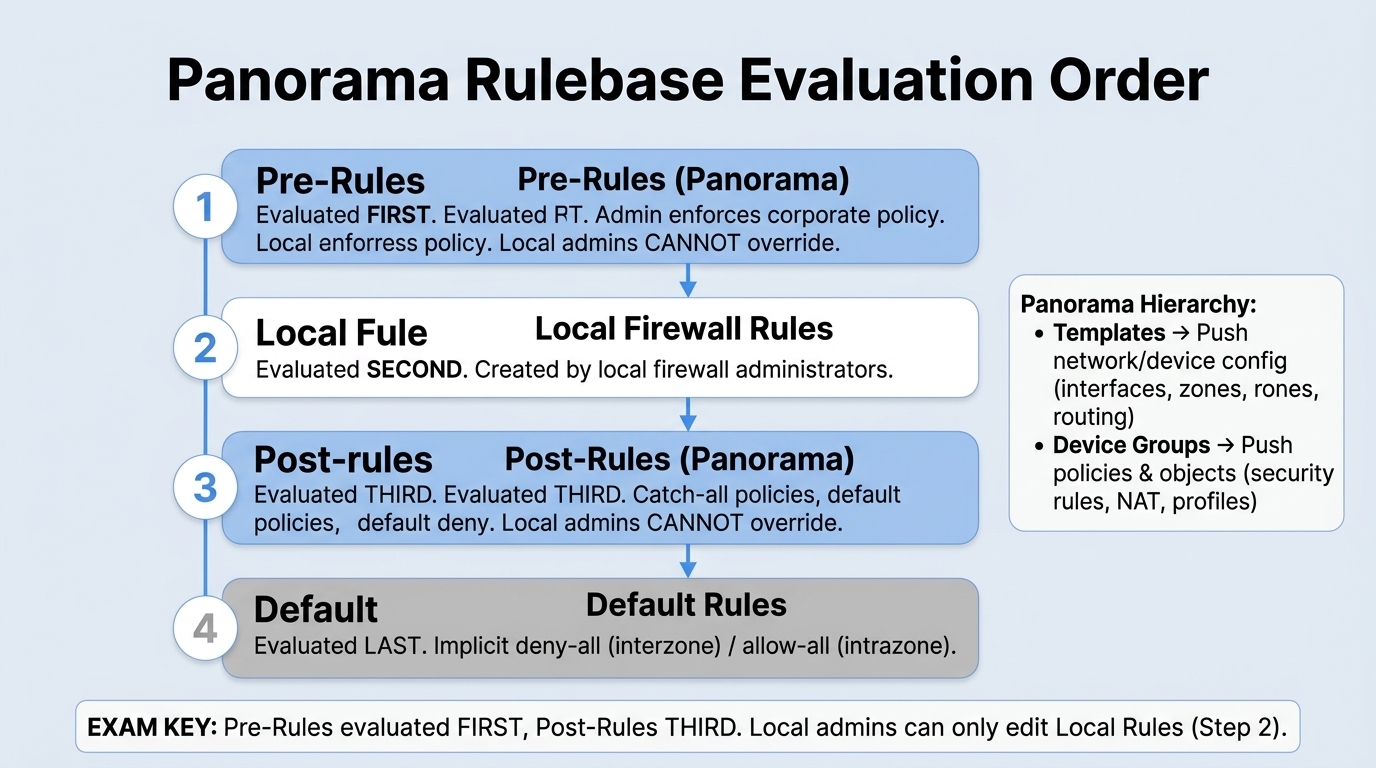
The evaluation order is fixed: Pre Rules, then local rules, then Post Rules, then defaults. Pre Rules are added to the top of the rule order and evaluated first — the canonical use case is enforcing an organization's Acceptable Use Policy, such as blocking specific URL categories or allowing DNS traffic globally, before any locally-defined rule gets a chance to override that intent. Post Rules sit at the bottom, evaluated after both Pre Rules and any rules defined locally on the managed firewall — the typical use case is catch-all denies based on App-ID, User-ID, or service, i.e. cleanup/backstop rules that shouldn't be bypassable by a permissive local rule placed "before" them from the local admin's point of view. Finally, Default Rules — predefined intrazone-allow and interzone-deny — handle anything that doesn't match a Pre Rule, Post Rule, or local rule at all, and can only be modified via an explicit Override.
Pre Rules and Post Rules are edited only on Panorama, never locally. Because these rules are defined and pushed from Panorama, a local firewall admin can view them (they appear inline in the local rulebase view, visually demarcated to show which device group or shared layer they came from) but cannot edit them directly on the firewall — any change has to happen back on Panorama and be re-pushed. This is precisely the mechanism that makes org-wide policy enforceable: a local admin physically cannot weaken or delete a Pre/Post Rule from their own box.
Shared vs. device-group scope is orthogonal to Pre/Post placement. Both Pre Rules and Post Rules can be defined either in a shared context (applying to every managed firewall across every device group) or scoped to a specific device group (applying only to firewalls in that group and its descendant device groups, following the device-group hierarchy's inheritance). A firewall's effective Pre-Rule layer, for instance, is the combination of any shared Pre Rules plus the Pre Rules from its own device group plus any inherited from ancestor device groups above it in the hierarchy — all still evaluated before that firewall's local rules.
Rule usage and targeting add operational visibility on top of this structure. Panorama tracks whether a pushed rule is actually Used, Partially Used, or Unused across the managed firewalls in scope (based on Policy Rule Hit Count data), and a rule's Target tab lets you scope a Panorama-defined rule to specific firewalls or device groups (or explicitly exclude specific ones) rather than applying it to every device by default — useful for a phased rollout of a new Pre/Post Rule before making it universal.
Diagrams: Palo Alto Networks Learning Center, Panorama course: Device group objects and policies. Click an image to enlarge.
Pros
- Centrally-enforced Pre/Post Rules guarantee org-wide policy that local admins structurally cannot bypass
- Local rules still exist in between Pre and Post Rules, preserving legitimate site-specific flexibility
- Device-group inheritance lets an organization layer policy hierarchically without duplicating rules per site
Cons
- A misplaced or overly broad Post Rule can silently override intended local-firewall behavior, since it's evaluated after local rules regardless of local admin intent
- Any Pre/Post Rule change requires a round-trip through Panorama and a re-push — no local emergency edit is possible even in an incident
- Understanding a given firewall's effective rulebase requires reasoning across shared, ancestor-device-group, and local-device-group layers simultaneously
Master Cheat Sheet Panorama Blueprint (Domain 3.4):
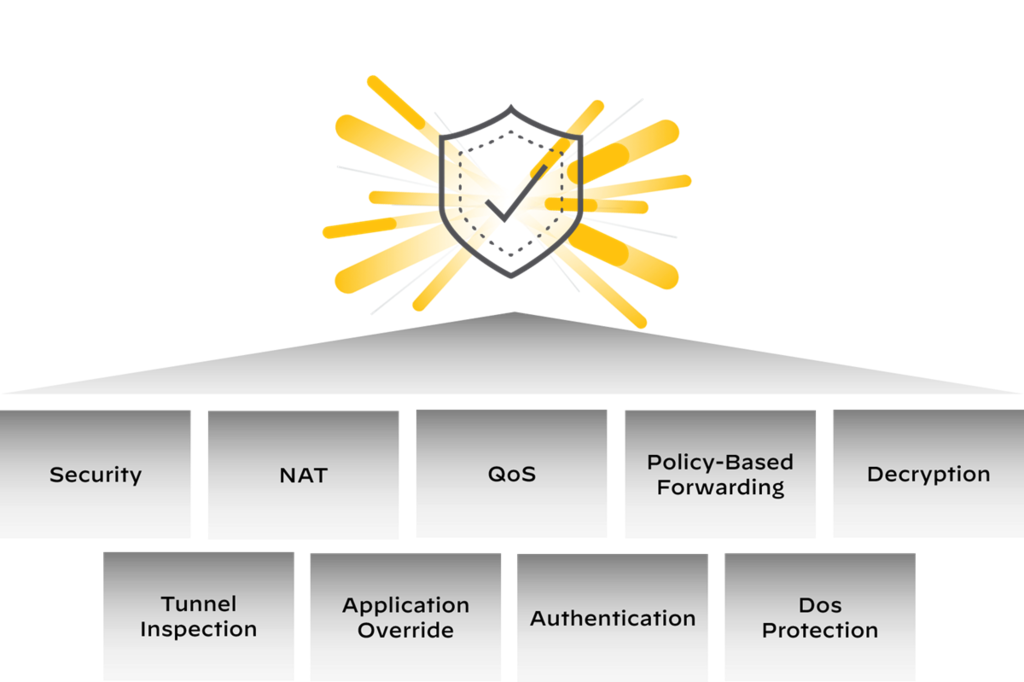
- Construct Division: Templates manage Network settings (interfaces, zones, virtual routers) and Device settings. Device Groups manage Security Policies, NAT rules, objects, and security profiles.
- Hierarchy & Inheritance: Configurations follow a parent-to-child hierarchy (Shared → Regional → Site). Devices inherit from parent device groups and template stacks.
- Pre-Rules (Top of Rulebase): Pushed from Panorama, evaluated first. Used for mandatory global security (e.g. blocking known malicious threat feeds, enforcing acceptable corporate web usage). Local firewalls cannot override them.
- Post-Rules (Bottom of Rulebase): Pushed from Panorama, evaluated last. Used for enterprise cleanup rules (e.g. default-deny logging, inter-vsys fallthrough).
| Rule / Construct Type | Evaluation Order / Scope | Definition & Core Purpose | Typical Use Case |
|---|---|---|---|
| Pre-Rules | 1st (Top of rulebase) | Pushed from Panorama; placed above the firewall's local rules. | Enforcing global policies that must apply to all firewalls (e.g., blocking known malicious IPs, compliance rules). |
| Local Rules | 2nd (Middle of rulebase) | Created and managed directly on the individual firewall by local administrators. | Site-specific exceptions, local application publishing, branch server access. |
| Post-Rules | 3rd (Bottom of rulebase) | Pushed from Panorama; placed below all local firewall rules. | Global cleanup rules, explicit default-deny with session logging, catch-all traffic enforcement. |
| Default Rules | 4th (Final fallback) | PAN-OS system rules: intrazone-default (Allow) and interzone-default (Deny). |
By default, intrazone traffic is allowed without logging; interzone is blocked without logging unless overridden. |
Panorama Verification CLI
Watch: short GUI walkthroughs
Clips from the Palo Alto Networks Learning Center. They load only when you press play.
Exam Trap
A question describing traffic that "should be blocked by a local deny rule but isn't" is frequently testing whether you know Post Rules are evaluated after local rules — if a Panorama-pushed Post Rule allows the traffic, it doesn't matter what the local rule says, because the local rule was already evaluated and presumably didn't match, or the Post Rule's allow is simply positioned to be hit for traffic the local rules didn't already handle. Don't assume "local" beats "central" in evaluation order — Pre Rules beat both, and Post Rules follow both.
Self-check: Panorama Pre-Rules, Post-Rules & Rulebase Ordering
Source: ngfw_help_11-1_panorama-web-interface_defining-policies-on-panorama.md; Palo Alto Next-Gen Firewall (NGFW) Master Cheat Sheet Domain 3.4
Automating Deployment — XML/REST API & Third-Party Tooling 60
Learning objectives
- Enumerate the PAN-OS XML API's request types beyond User-ID push, and explain the config-action model
- Explain why API-key auth, not username/password, is the standard automation credential pattern
- Place Terraform and Ansible correctly as third-party tooling layered on top of the same API surface
User-ID's XML API usage for pushing IP-to-user mappings is only one narrow use of a much broader automation surface — the PAN-OS XML API (and its newer REST API sibling) is a general-purpose way to read and change nearly anything on a firewall or Panorama programmatically, which is what third-party infrastructure-as-code tooling is actually built on top of.
Why
Manually clicking through the Web UI doesn't scale to fleets of firewalls, doesn't fit into CI/CD change pipelines, and can't be code-reviewed or version-controlled the way infrastructure-as-code expects. The XML API exists so that every operation an admin can do by hand — edit config, commit, run an operational command, pull a report — has a programmatic equivalent that automation can drive instead.How
Every request is built from the same four parts. A PAN-OS XML API request
is a URL (or POST body) combining an API key (for authentication), a request
type (which functional area you're calling into), an action
(only for config and op type requests — what you want done), and an
xpath or cmd element (which XML config node, or which
operational command, you're targeting). GET requests work for queries under ~2KB; POST is
required for larger payloads (up to 5MB) or when passing non-ASCII data, and is mandatory for
operations like file imports.
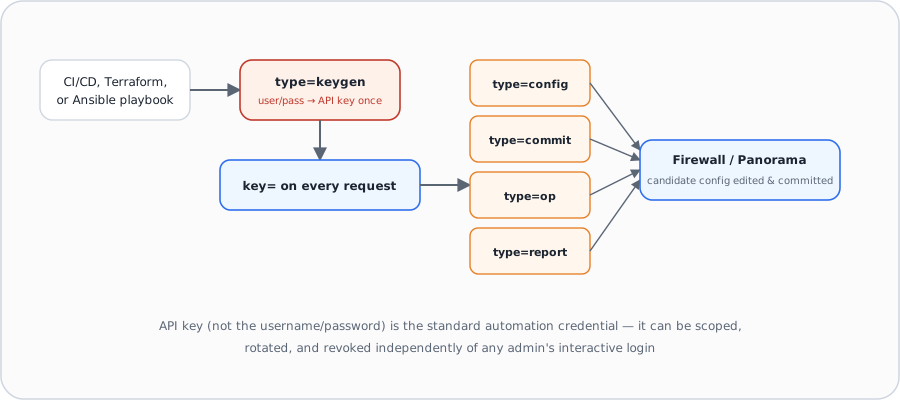
Request types cover far more than User-ID. Beyond type=user-id
(the mapping-push use case covered under Identity & Access), the API exposes:
type=keygen (exchange a username/password once for a long-lived API key —
this is the credential automation actually uses afterward, not the raw
username/password), type=config (read or modify the candidate configuration),
type=commit (commit changes, including partial/filtered commits),
type=op (run operational-mode commands — status checks, config validation, and
more), type=report (pull predefined, dynamic, or custom reports),
type=log (retrieve traffic/threat/event logs), type=import /
type=export (move configs, certificates, packet captures, and keys in and out),
and type=version (identify PAN-OS version, serial number, model). Configuration
actions under type=config mirror what you'd do in the Web UI one-for-one: set,
edit, delete, rename, clone, move, override a template value, or — for bulk operations —
multi-move and multi-clone across a device group or vsys, plus a complete action
that returns valid subnode values/XPaths for a given XPath, useful for discovering the config
tree programmatically rather than guessing paths by hand.
REST API — a newer, resource-oriented alternative for the same surface.
Where the XML API models everything as XPath-addressed XML nodes, PAN-OS's REST API exposes
policy objects (Security rules and others) as conventional REST resources — closer to what
most modern automation tooling and API clients expect by default, and generally the more
approachable starting point for teams without an existing XML API integration to maintain.
Composite objects show the pattern: dependencies are created first and the parent last.
SD-WAN is not in the blueprint, but the practice sets use it as the example — the virtual
interface (sdwanInterfaces) is the last object created, after its link
tag, sdwanInterfaceprofiles and physical Ethernet interface exist. Object
location follows the object type: interfaces and profiles use
location=template&template=<name> on Panorama, while tags are
objects and use location=device-group.
API-key auth is the standard automation credential, not username/password.
Automation should call type=keygen once to exchange credentials for an API key,
then use that key (key=) on every subsequent request. This matters operationally
because the key can be scoped to a specific admin account's permissions, rotated or revoked
independently of that admin's interactive login, and never needs to be re-transmitted after
the initial exchange — none of which is true if a script embeds a raw username/password and
re-authenticates on every call.
Terraform and Ansible sit on top of this same API, not beside it.
Terraform (covered earlier in this guide for
infrastructure provisioning) uses a PAN-OS provider that translates Terraform resource
definitions into the same underlying XML/REST API calls. Ansible exposes the
same surface through the official paloaltonetworks.panos collection
(ansible-galaxy collection install paloaltonetworks.panos, Apache-2.0,
officially supported via Ansible Automation Hub) — under the hood it's built on Palo Alto's
own pan-os-python SDK rather than talking XML by hand, so a playbook task
describing desired firewall/Panorama state declaratively still bottoms out as config
set/edit and commit calls against the exact same API surface described above. It also ships
a companion panos-upgrade-assurance package specifically for scripting the
PAN-OS upgrade workflow — readiness checks before an upgrade
and state comparison after one — rather than leaving that as a manual, click-through process
even when everything else is automated. The practical implication for the exam: whichever
IaC tool is named in a scenario, the underlying mechanism is still the PAN-OS API and an
API-key credential — the tool is a convenience layer, not a separate integration path.
Pros
- One API surface backs the Web UI, CLI equivalents, and every third-party IaC integration — there's no separate "automation-only" feature set to fall behind
- API-key auth lets automation credentials be scoped, rotated, and revoked independently of interactive admin logins
- The REST API's resource-oriented model lowers the integration barrier compared to raw XPath-based XML calls
Cons
- The XML API's XPath addressing has a real learning curve compared to a conventional REST resource model
- A leaked or over-scoped API key inherits whatever permissions its source admin account has — key hygiene matters as much as password hygiene ever did
- Partial/filtered commits via the API carry the same cross-admin dependency risk covered under the commit workflow — automation doesn't remove that risk, it just triggers it programmatically
Exam Trap
Don't assume the XML API is only for User-ID mapping — a question describing bulk configuration push, scheduled commits, or programmatic report pulls is still squarely in XML/REST API territory, just a different request type (config, commit, report) than the User-ID use case. Also remember: type=keygen is a one-time credential exchange, not something re-run on every automated request — the resulting key is what gets reused.
Tool split the dumps test: Terraform = provision
infrastructure (spin up VM-Series / Cloud NGFW instances, VPCs, GWLB). Ansible
(PAN-OS collection, built on the API) = configure policy/objects across many existing
firewalls, and is the pick for "orchestrate policy across multiple NGFWs in a multi-cloud
environment". The canonical combo: Terraform to provision + Ansible to configure,
with Panorama for central policy. REST API to create a resource = POST
/restapi/v10.x/<area>/<resource>; the API key comes from an admin account with
the right RBAC role.
Self-check: Automating Deployment
📋 Cheat Sheet — Deployment Options Domain 3.1-3.3
| Deployment Options | Description |
|---|---|
| PA-Series | Hardware on-prem |
| VM-Series | Virtual (ESXi/KVM/cloud IaaS) |
| CN-Series | Kubernetes containers |
| Cloud NGFW | Managed cloud service |
- Terraform: Day 0 infrastructure provisioning (create NGFW instances)
- Ansible: Day 1+ config management (push policies to existing devices)
Source: ngfw_api_getting-started_structure-of-a-pan-os-xml-api-request.md; ngfw_api_pan-os-xml-api-request-types-and-actions.md
Module Quiz
1. A team is planning a large firewall fleet and wants to know which capability specifically requires Panorama as the provisioning point, rather than merely benefiting from it. Which one is it?
2. A SOC lead wants a tool that surfaces suspicious patterns across logs automatically, instead of requiring an analyst to build and run manual filters. Which tool fits?
3. An engineer attaches a Log Forwarding profile to a Security rule but still doesn't see WildFire Submission logs arriving at the SIEM. What is the most likely cause?
4. A single forwarded log record exceeds 4,096 bytes. What happens to the excess data?
5. A high-throughput data-center deployment needs dedicated hardware log interfaces rather than sending logs out the management interface. Which platform family specifically requires this?
6. A customer is trying to avoid sizing and forecasting on-prem Log Collector storage as their fleet grows. Which capability removes that specific capacity-planning problem?
7. A Kubernetes-heavy environment wants a single, unified log destination that both its CN-Series firewalls and its PA-Series hardware can forward to once licensed. Which two firewall types can forward logs to Strata Logging Service? (Choose two.)
8. While troubleshooting, an engineer finds a Traffic log entry with Log Type "drop" and Session ID 0. What does this combination indicate?
9. A user reports a file download was blocked, but when the admin checks the Traffic log, the Action column for that session shows "allow." How is this possible?
10. A compliance reviewer asks exactly what categories of data Device Telemetry uploads to Palo Alto Networks. Which answer is accurate?
11. Integrity Measurement Architecture (IMA) detects a platform integrity violation on a production firewall. What happens by default?
12. Which of these is a documented, platform-specific monitoring caveat an engineer should account for when planning a small-branch deployment?
13. A firewall running PAN-OS 10.2.4 needs to reach 11.1.2. Can the admin install 11.1.2 directly without installing 11.1.0 first?
14. Which two statements correctly describe Panorama Log Collectors and Collector Groups? (Choose two.)
15. An organization wants a URL-category block enforced identically on every managed firewall, with no possibility of a local admin overriding it. Where should this rule be defined, and in what layer?
16. An automation script needs to authenticate to the PAN-OS XML API repeatedly over several months without re-sending an admin's username and password on every call. What should it use?
17. What role does Terraform play when deploying Palo Alto Networks NGFWs?
18. By default, which traffic type is bound to use the management interface via service route configuration?
19. Panorama-managed firewalls are already onboarded to Strata Logging Service with certificates installed. What single configuration step starts sending logs to Strata Logging Service while still forwarding them to the existing Panorama log collectors?
20. When a firewall is managed by Panorama, in what order are Security policy rules evaluated?
21. A mission-critical network has zero tolerance for application downtime. Compared to a security-first network, what recommended dynamic-update content threshold should it schedule, and why?
22. Which set of forwarding methods is available in a Log Forwarding profile's match-list actions?
23. In a hybrid cloud deployment, what is Ansible's primary role in managing NGFWs?
24. Building a virtual SD-WAN interface via the REST API against a Panorama template, in what order must the objects actually be created?
25. Without performing a Panorama "context switch" into a managed firewall, which set of changes can still be pushed to that firewall directly from the Panorama GUI?
26. Which set of detailed log types is available when building a custom report on a PAN-OS firewall?
27. What is the maximum number of Log Collectors that can belong to a single Log Collector Group?